We future-proof your company locations
die Zukunft.
Save up to 30% on energy costs
Reduce energy costs with future-oriented analyses and dynamic electricity tariffs. We accompany you on your journey into the new energy world – from the first step to intelligent energy management.
Wir liefern die Werkzeuge für Ihren Weg in die neue Energiewelt.
Wir liefern die Werkzeuge für Ihren Weg in die neue Energiewelt.


Let our energy experts advise you in a free initial consultation.
Companies that rely on Gridty
.png)


%201.png)


As Featured In


Towards a sustainable energy future.
Our mission at Gridty: Transforming complex energy issues into simple decisions.
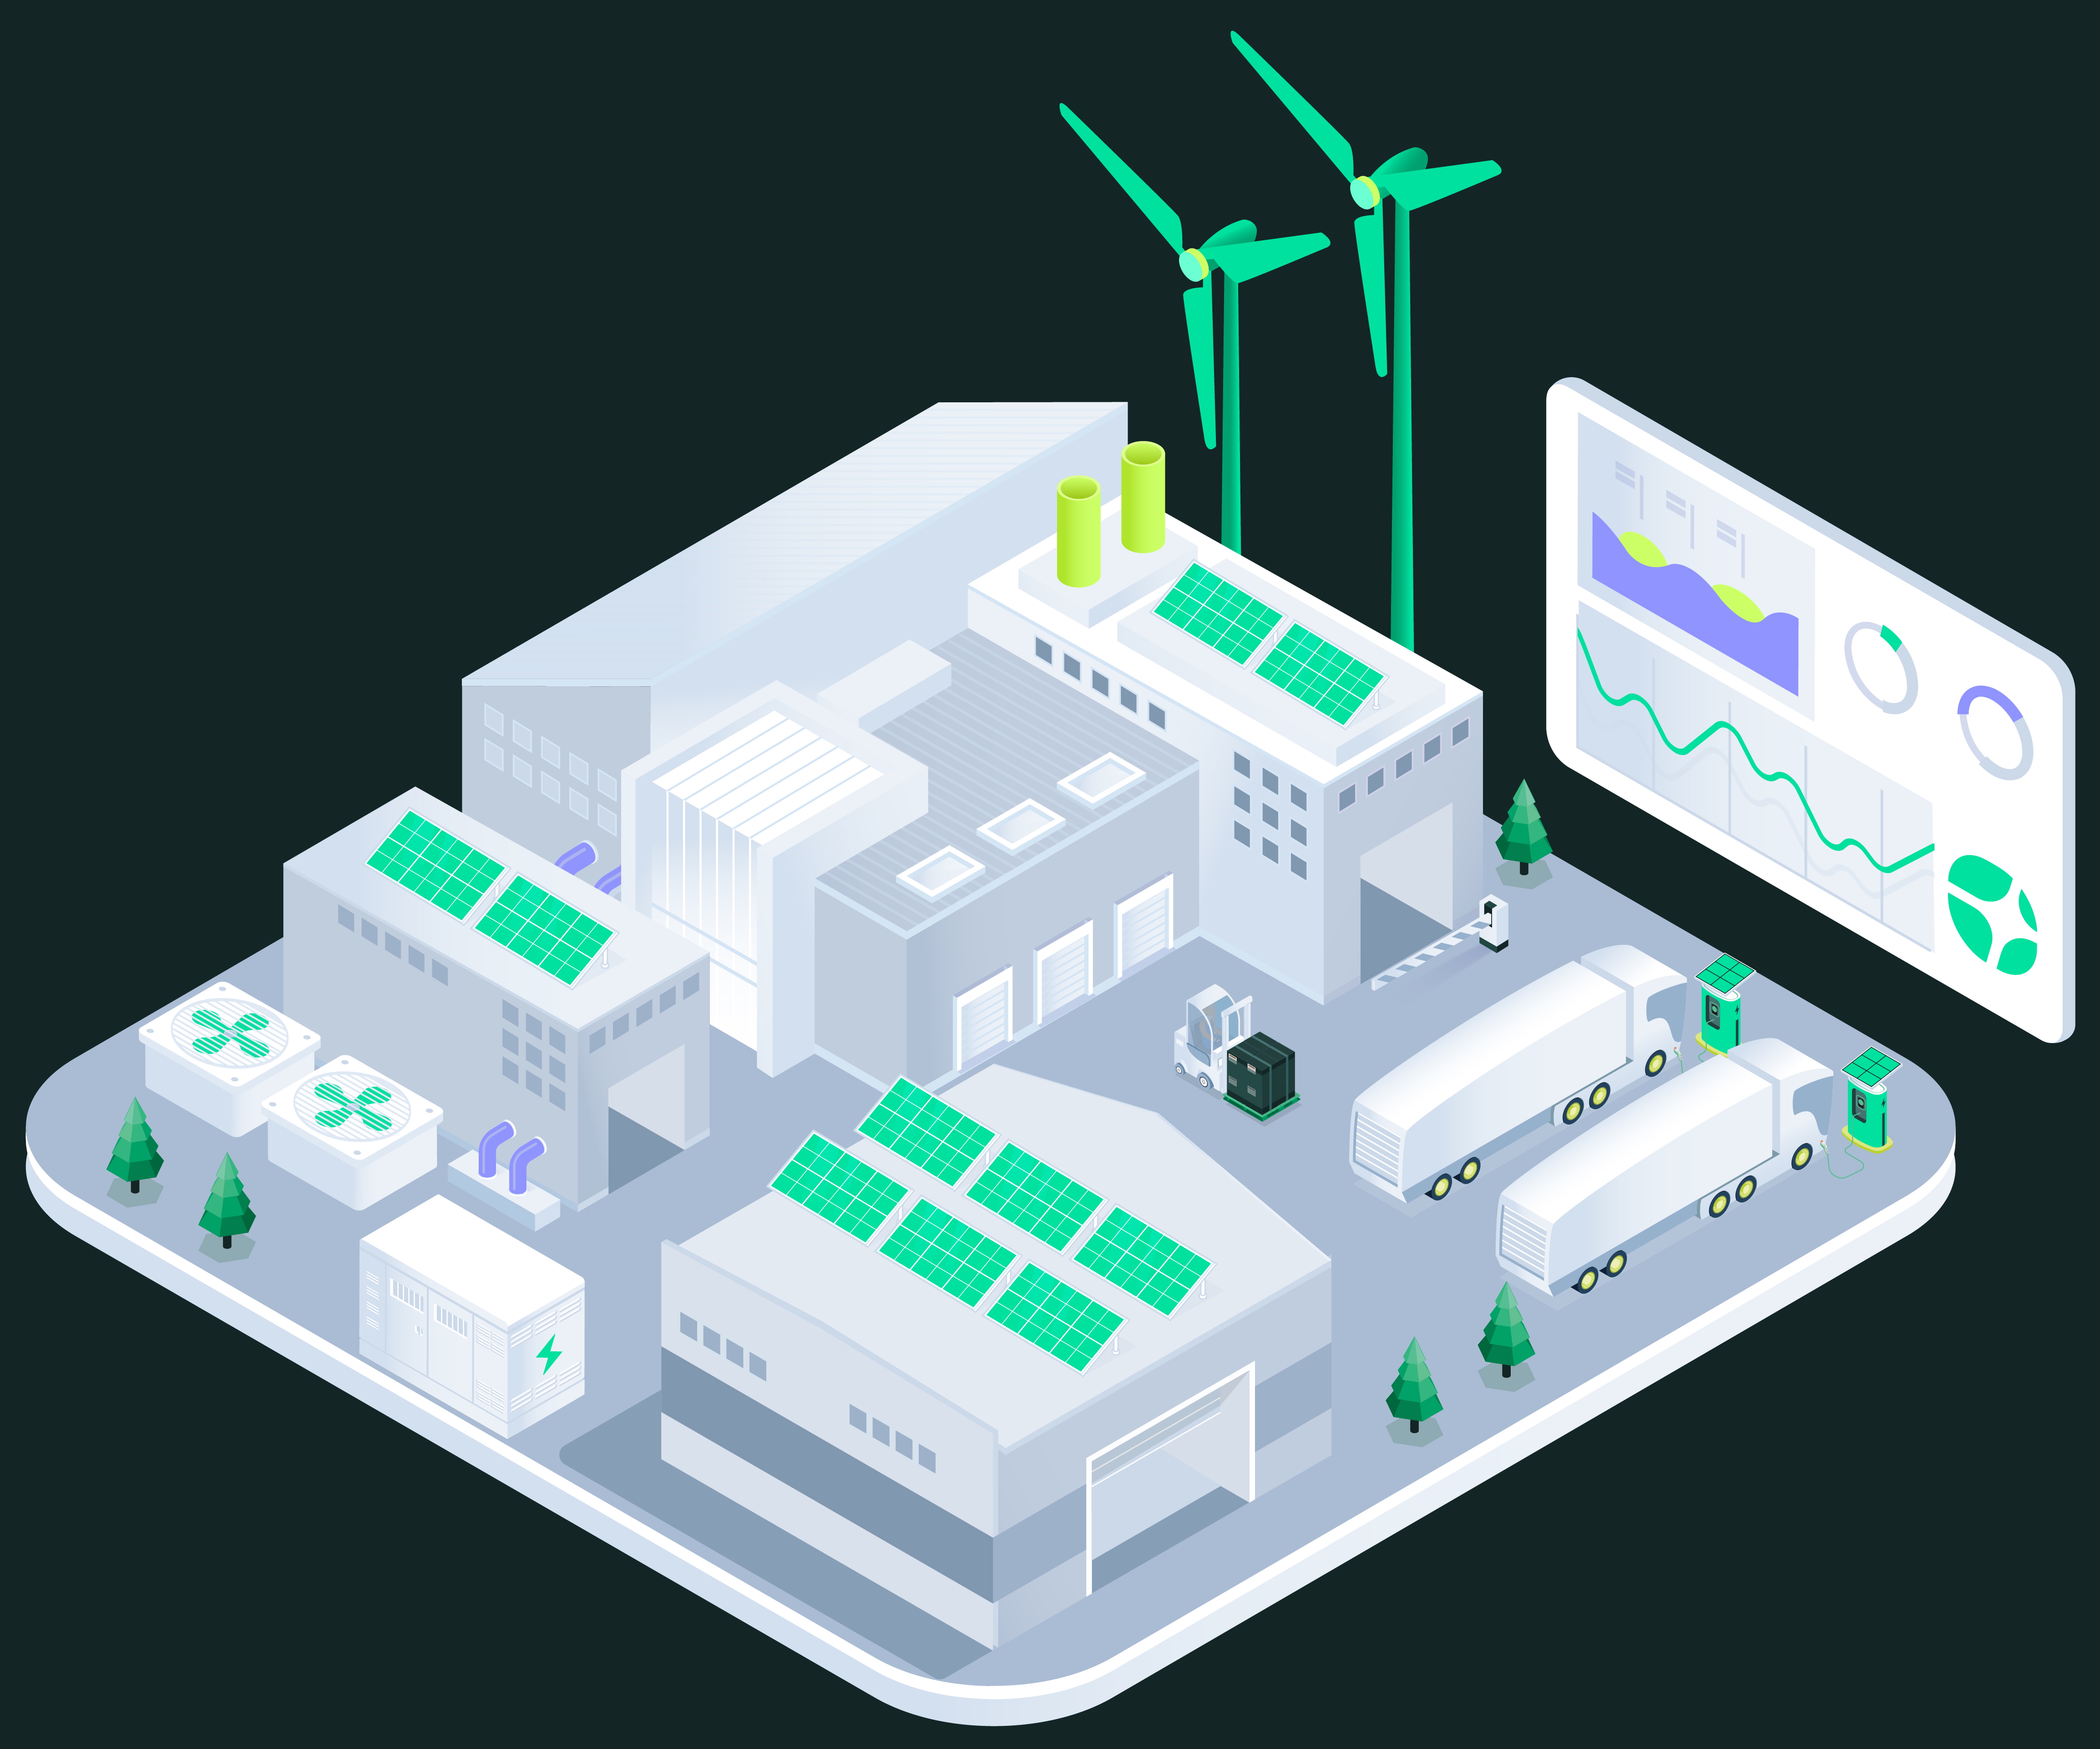
With intelligent energy analyses, customized energy concepts, and certified audits, we help companies reduce energy costs, conserve resources, and secure their long-term future.
With intelligent energy analyses, customized energy concepts, and certified audits, we help companies reduce energy costs, conserve resources, and secure their long-term future.

Advanced energy analysis
Precise results thanks to state-of-the-art algorithms.

Customized
solutions
Tailored to your needs, buildings, and business goals.
mit Wärme-, Kälte- und Batteriespeichern.
mit Wärme-, Kälte- und Batteriespeichern.

Comprehensive support
We support you from initial analysis to actual cost savings.
Your path to a sustainable energy solution – step by step
Clear, efficient, and individualized for your locations.

1. Individual energy analysis
After a free initial consultation, we assess your current situation and identify potential energy savings.
2. Customized energy concept
Based on the analysis, we develop a customized energy concept that precisely meets your requirements.

3. Support during implementation
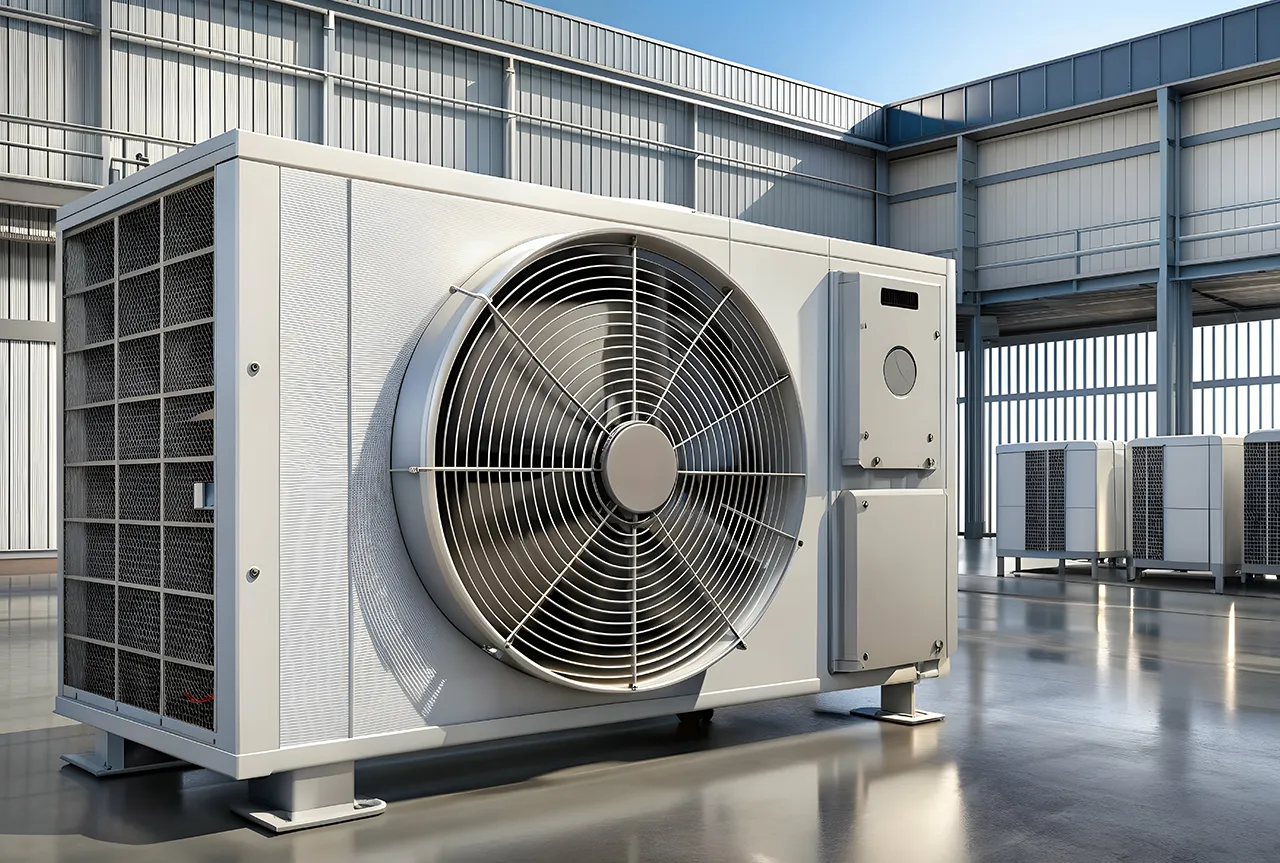
We assist you in selecting the right combination of technologies and help you find the right partner for your energy future.
4. Long-term
support
We remain at your side as a trusted partner and help you to further optimize your energy performance.
Reference Projects: What Our Customers Say
Discover what Gridty has achieved with tailored solutions.
.png)
Gewerbegebäude
Nachhaltige Sanierung mit Einsparpotenzialen
"Mit Gridty konnten wir innerhalb kürzester Zeit eine fundierte Analyse für Wärmepumpen, Photovoltaik und Speicherlösungen erstellen. Die Ergebnisse waren klar, praxisnah und eine große Hilfe bei der Entscheidungsfindung im Projekt."

Laurin Kling
Bauprojektmanager, EnBW Corporate Real Estate
Bauprojektmanager, EnBW Corporate Real Estate
Logistics
Increased efficiency through dynamic electricity tariffs
"With Gridty, we found a partner who gave us excellent advice on dynamic electricity tariffs. Thanks to Gridty's energy concept, we were able to significantly reduce our electricity costs – without any upfront investment. For us, this opened up an entirely new opportunity"
.webp)
Christian Mann
CEO, Auto Mann GmbH
CEO, Auto Mann GmbH
Gridty live on stage
Our Co-Founder & CTO, Thomas, presented at the Proptech Summit 2025, showcasing the vision and technology behind Gridty.
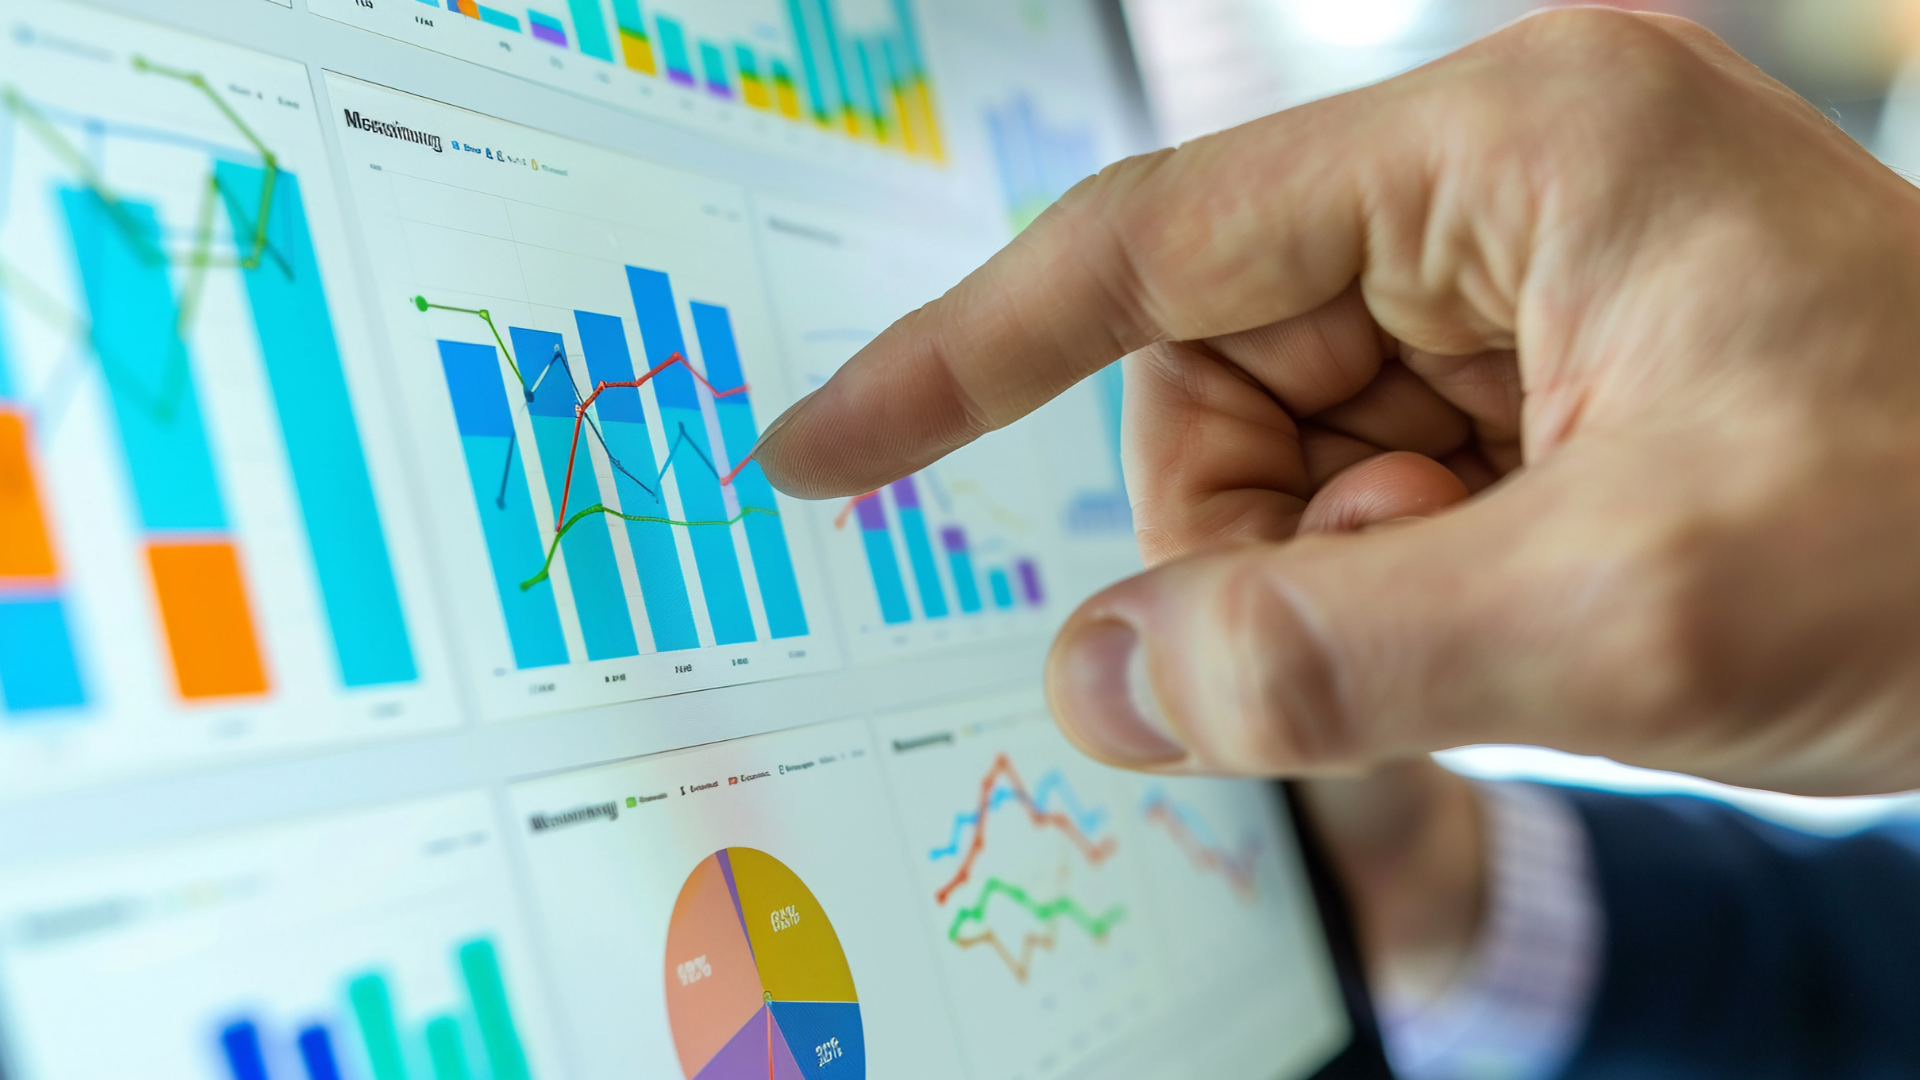
In his pitch, you’ll see how we help companies identify energy-saving potential in a data-driven way – and turn it into concrete actions.
In his pitch, you’ll see how we help companies identify energy-saving potential in a data-driven way – and turn it into concrete actions.
Efficiency redefined:
Save up to
Gridty analysiert, bewertet und optimiert Ihr Energiesystem.
Individual energy analysis
Check consumption, identify potential, save costs.
More about energy analysis
More about energy analysis

Energy audit as per DIN 16247
Standardized analysis for transparency, efficiency, and eligibility for subsidies.
Comprehensive energy support
From analysis to implementation – we support you every step of the way.
Would you like to talk to us in person?
Feel free to give us a call or write to us via the contact form

Request Your Individual Energy Analysis Now
Simple, fast, and non-binding – Book your personal consultation today.
Gridty GmbH
Neue Weyerstraße 6
50676 Köln
Neue Weyerstraße 6
50676 Köln
Mail: info@gridty.com
We look forward to hearing from you – let’s make an impact together.
Thank you! Your submission has been received!
Oops! Something went wrong while submitting the form.
Companies that rely on Gridty
.webp)
What exactly does Gridty do?
Gridty supports companies in optimizing the energy efficiency of their sites, buildings, and vehicle fleets. We analyze energy consumption, identify potential savings, and develop data-based strategies, e.g., for PV, storage, charging infrastructure, or heat pumps. Everything is modular, scalable, and tailored to your infrastructure.
What do you need to get started?
For the initial analysis, we just need your electricity consumption data (e.g., load profiles) and basic info about your buildings, vehicle fleet, or tech. We can share data digitally, or we can come to you if needed. We usually deliver the first results in a few weeks so you can make solid decisions fast.
Is Gridty more of a software or consulting company?
Both. We not only provide data, but also clear recommendations and, if desired, accompany you through to implementation with experienced technology partners from our network. In addition, we prepare ESG-compliant reports, simulate CO₂ reduction paths, and identify funding opportunities. This gives you a strategic basis for your sustainability goals.
Who is Gridty suitable for?
Gridty is designed for companies with one or more corporate properties, large building areas, or vehicle fleets – especially when there is no in-house energy expertise. We make energy management feasible even without a dedicated internal department.
Smart energy.
Strong future.
Smart energy.
Smart energy.
Smart energy.
Smart energy.
self-sufficient and resilient.
Ready for a secure energy future?
Contact

.webp)


.webp)





.webp)
.webp)